
On this page
I ran Lighthouse 25 times on the same WooCommerce shop page, five runs per mode, and changed one flag between batches. The default mode scored 97, 97, 96, 97 and 97. DevTools throttling scored 95, 95, 96, 85 and 84.
With throttling off, I got 99 once and 100 four times. Same page, same Mac, all 25 runs inside 12 minutes. Nothing on the store changed between them.
The store didn’t change, so the 85 and the 84 aren’t a slower page. They were two slow real loads, in a mode that scores whatever really happens.
The default mode never measures a slow load at all. It loads the page at full speed and estimates the rest.
What Lighthouse does by default
Lighthouse 13.6.0 sets throttlingMethod: 'simulate' in its default config (core/config/constants.js). The network profile it simulates is called mobileSlow4G:
- A 150 ms round trip time.
- 1.6 Mbps down and 750 Kbps up.
- A CPU four times slower than the machine running the test.
The Lighthouse throttling doc says these numbers match “roughly the bottom 25% of 4G connections and top 25% of 3G connections”. The same profile used to be labeled “Fast 3G”.
The PageSpeed Insights about page still names a Moto G4 as the phone. My 13.6.0 reports sent a “moto g power (2022)” user agent instead, with a 412 by 823 screen.

Lighthouse loads your page once with no throttling and records every request and every CPU task. Then it runs that recording through a model called Lantern, which predicts how the load would go on the slow phone. The doc calls this fast and deterministic, with “inherent inaccuracy” for some edge cases.
You can see it in the JSON report. In my first default run, the largest element on the shop page painted after 1,469 ms on my Mac. Lighthouse reported an LCP of 2.2 seconds.
The 1.5 seconds is what happened. The 2.2 is the estimate for the phone, and that’s the number that goes into the score.
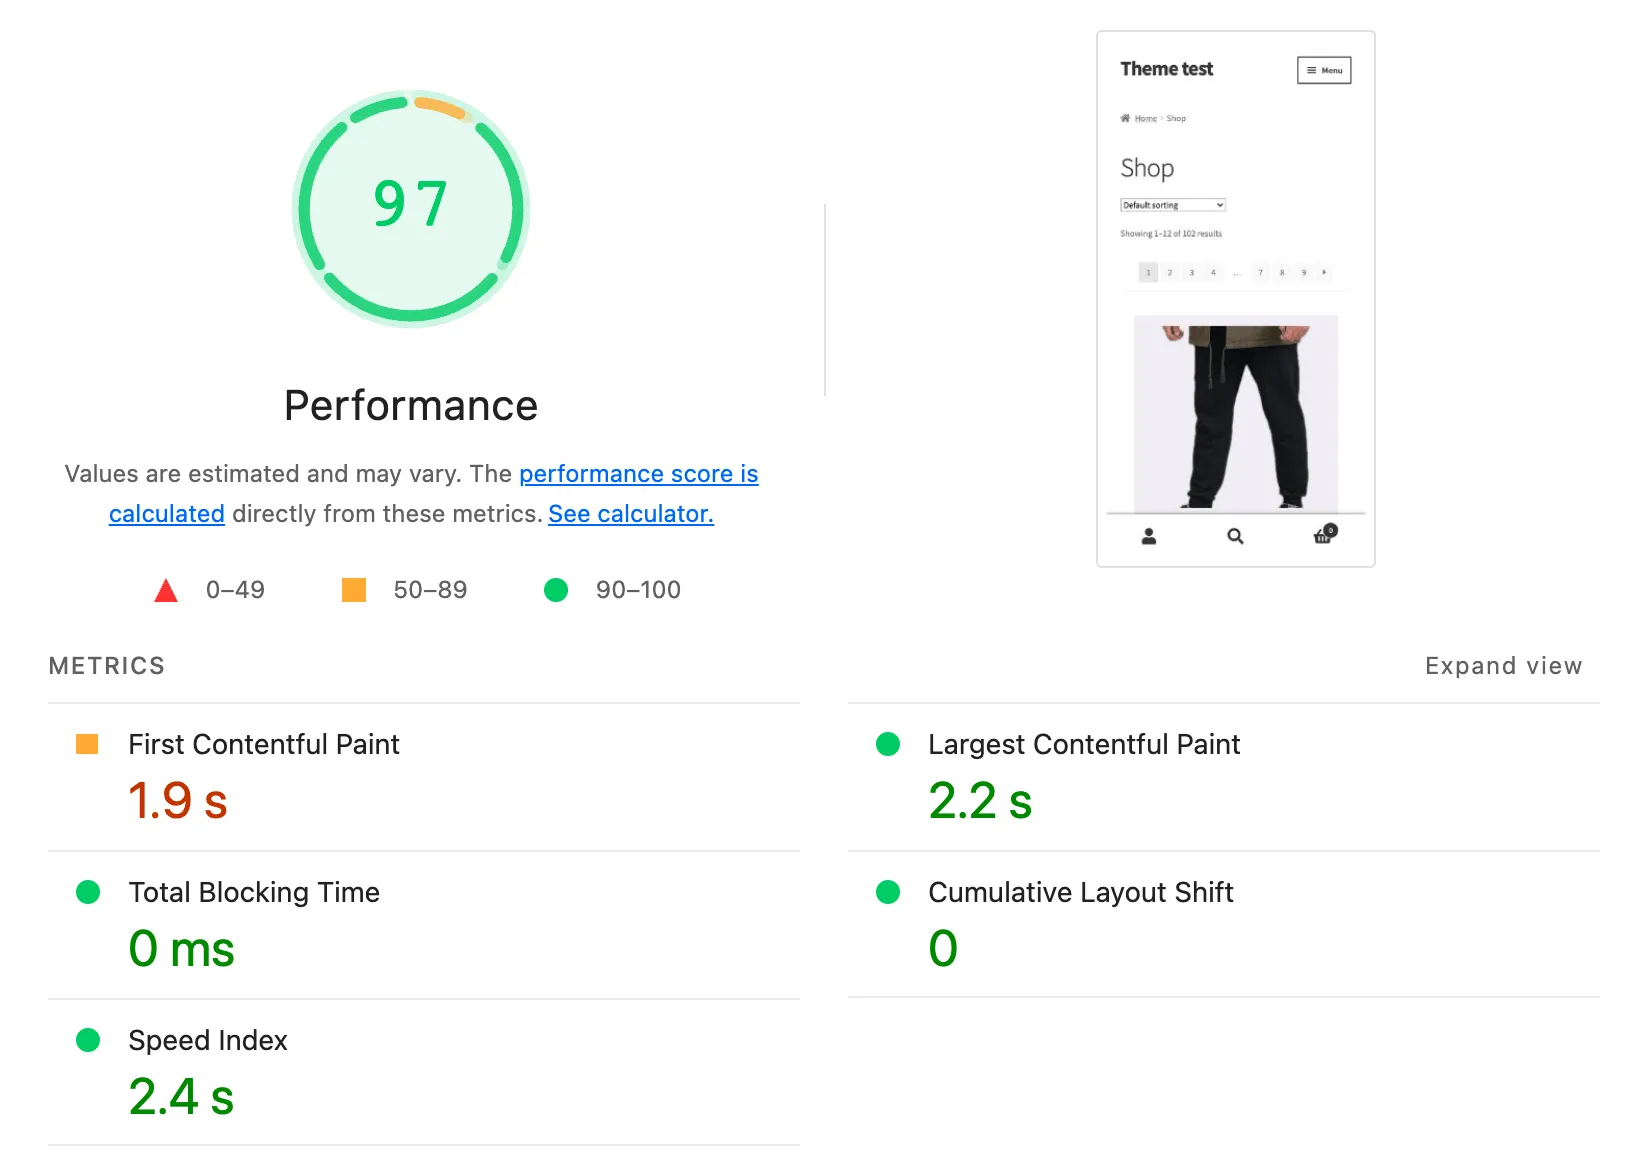
Across all five default runs, the real paint time moved between 1.1 and 1.7 seconds. The reported LCP stayed between 2.16 and 2.24. The model absorbs most of what my machine and my network did on each run.
The test
The store is a local WooCommerce test site on my Mac: Storefront theme, WooCommerce 11.3.0, 102 sample products. I tested the shop page because it has the most product images and the most markup on the store.
The Mac is an M3 Pro, and Lighthouse ran headless in Chrome 157. These are the five commands, with the URL swapped for a placeholder:
npx lighthouse <shop-url> --only-categories=performance --throttling-method=simulate --chrome-flags="--headless=new --ignore-certificate-errors"
npx lighthouse <shop-url> --only-categories=performance --throttling-method=devtools --chrome-flags="--headless=new --ignore-certificate-errors"
npx lighthouse <shop-url> --only-categories=performance --throttling-method=provided --chrome-flags="--headless=new --ignore-certificate-errors"
npx lighthouse <shop-url> --only-categories=performance --preset=desktop --chrome-flags="--headless=new --ignore-certificate-errors"
npx lighthouse <shop-url> --only-categories=performance --throttling.cpuSlowdownMultiplier=6 --chrome-flags="--headless=new --ignore-certificate-errors"
The Chrome flags are there because the local store uses its own certificate. I pinned Lighthouse to 13.6.0 when I ran these. npm view lighthouse version printed 13.6.0 that day too, so it was the latest release. npx can reuse a cached copy, so check npx lighthouse --version before you compare your numbers with mine.
Each command ran five times, one after another, never in parallel, on November 15, 2026.
| Mode | Scores | Median | LCP (median) | TBT (median) | CLS |
|---|---|---|---|---|---|
| Simulated (default) | 97, 97, 96, 97, 97 | 97 | 2.2 s | 3 ms | 0 |
| DevTools throttling | 95, 95, 96, 85, 84 | 95 | 2.4 s | 0 ms | 0.001 |
| No throttling (provided) | 99, 100, 100, 100, 100 | 100 | 1.4 s | 0 ms | 0 |
| Desktop preset | 91, 89, 90, 90, 91 | 90 | 1.1 s | 0 ms | 0.171 |
| Simulated, 6x CPU | 97, 97, 97, 97, 97 | 97 | 2.2 s | 15 ms | 0 |
What turned up
The default mode was the steadiest of the throttled ones. Five runs landed within one point, and the reported LCP moved by less than a tenth of a second.
DevTools throttling started out close to it, with 95, 95 and 96. Then runs four and five took 3.4 seconds to paint and scored 85 and 84. I didn’t change anything between those runs, and I don’t know what slowed them.
My first try at this test, earlier the same day, used three runs per mode. One DevTools run in that batch scored 69, next to a 94 and a 95.
The default mode’s median moved between the two batches too, from 94 to 97, a few hours apart.
In DevTools mode, the reported numbers are the real load. Run five shows an observed LCP of 3,385 ms in the JSON and a reported LCP of 3.4 s.
The throttling doc says the same about the DevTools panel: with DevTools throttling, the trace you open “will match” Lighthouse’s numbers. With simulated throttling, it doesn’t, because the trace comes from the fast load before the estimate.
No throttling told me almost nothing. A 100 on a local store, on a fast Mac, with no network in between, is a number for my machine. No customer loads the shop like that.
Desktop scored 90, below every run in the default mobile mode.
The desktop preset uses a faster profile: 10 Mbps, a 40 ms round trip and no CPU slowdown.
It also uses a 1350 px wide screen, and at that width Storefront’s main content area shifted after it loaded. Lighthouse put 0.167 of the 0.171 layout shift on the #content block, in all five runs. The mobile runs never saw it.
Layout shift is 25% of the performance score in Lighthouse 13. On desktop, the CLS audit scored 0.7, so that one shift took about seven and a half points off. On mobile, every throttled metric together took three or four points off each default run.
Raising the CPU slowdown to 6x changed nothing in the score: 97 on all five runs. Total Blocking Time went from a median of 3 ms to 15 ms.
This shop page doesn’t run much JavaScript, so a slower CPU has little to slow down. I didn’t test a heavier page, so I can’t say how big the gap gets with a slider or a chat widget.
DevTools throttling vs simulated throttling
Neither mode is a real slow phone. DevTools throttling slows each request, while a real network slows things down packet by packet, so the throttling doc says it “isn’t highly accurate”.
Lighthouse adds correction factors to make up for it. In my DevTools reports, the 150 ms round trip became a requestLatencyMs of 562.5, which is 150 times 3.75. The 1.6 Mbps became 1,474.56 Kbps, which is 90% of 1,638.4.
Simulated throttling makes the opposite trade. It filters out most of the noise from your network and your machine, which fits how close my default runs stayed.
But it’s a prediction. The doc says it’s “roughly as accurate or better than DevTools throttling for most sites”, and the edge cases are where it misses.
The variability doc has a table for this. Simulated throttling mitigates local network swings and partly mitigates noise from your hardware, other apps and the browser.
DevTools throttling partly helps with the network and the web server, and does nothing for the rest. No throttling helps with nothing.
CPU throttling and your benchmark index
The 4x CPU slowdown is relative to the machine running the test. Lighthouse saves a benchmarkIndex in every report so you can see how fast that machine was. Across my 25 runs it ranged from 2,343 to 2,663.
The throttling doc puts a high-end desktop at 1,500 to 2,000. My Mac sits above that range, so on paper 4x leaves it a bit faster than the mid-tier phone Lighthouse is aiming for.
The doc’s advice is to pick a higher multiplier when your index sits at the top of its bracket. That’s why I tried 6x. On this page it didn’t move the score.
How to change the throttling method
From the command line, add --throttling-method=simulate, devtools or provided. Simulate is the default, so leaving the flag out gives you the same thing. For the CPU, add --throttling.cpuSlowdownMultiplier=6, or whatever number fits your machine.
In Chrome, open DevTools, go to the Lighthouse panel and click the Settings button. The Chrome DevTools Lighthouse docs list a Throttling drop-down there, with Lighthouse simulated throttling and DevTools throttling as the choices.
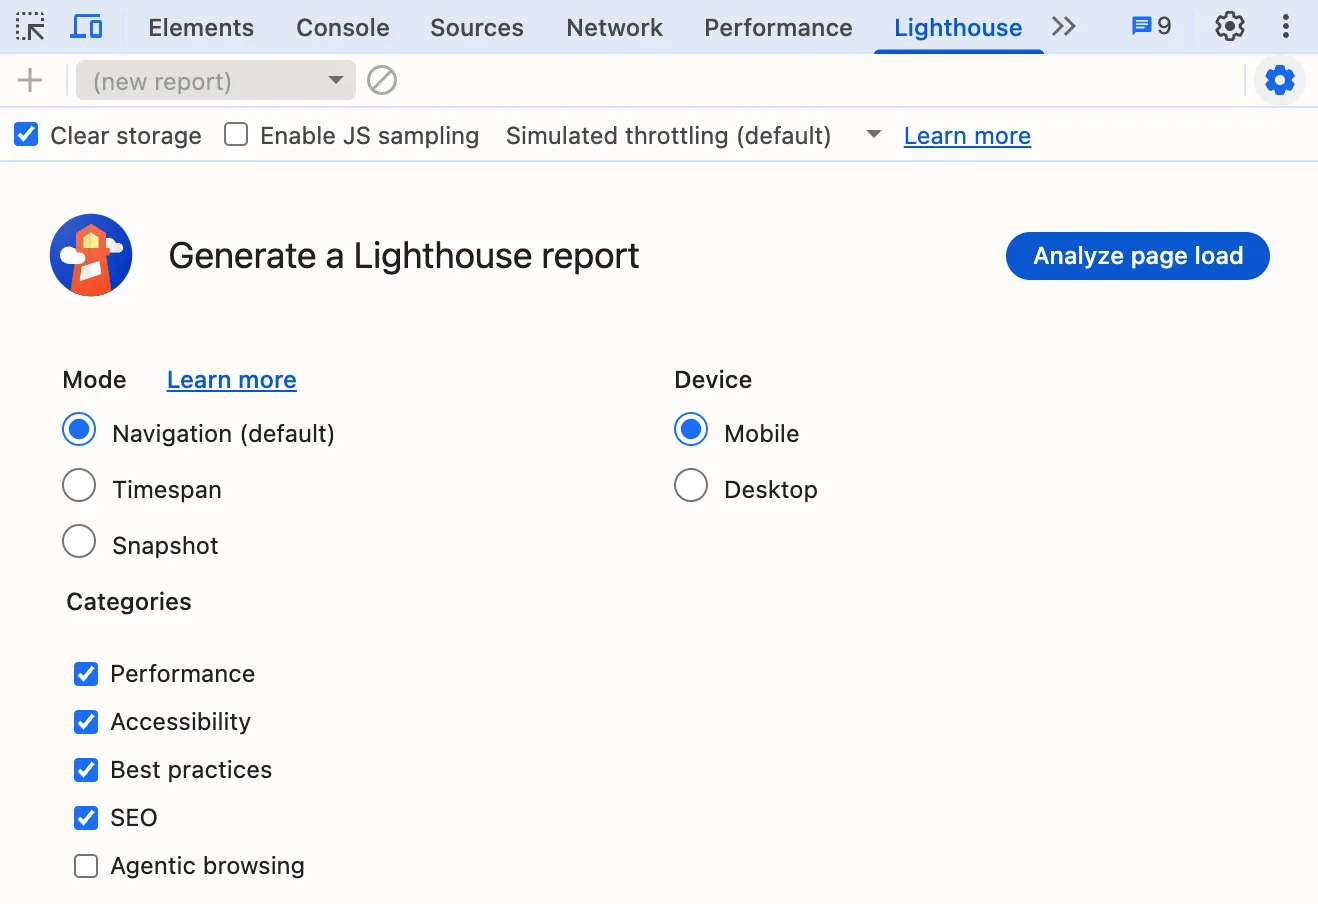
PageSpeed Insights uses the simulated setup. Simulated is also the default in the DevTools panel and the CLI. I wrote about why the two still give different scores in Google PageSpeed vs Lighthouse.
Which mode I’d pick
For before and after comparisons, like checking a store before and after a plugin change, I’d stay on the default simulated mode. It was the steadiest throttled mode in this test, and it’s what PageSpeed Insights uses, so local numbers and hosted ones line up.
For a close look at one slow page, I’d switch to DevTools throttling. It’s the mode where the trace and the score agree, so the timeline you open is the load that got scored.
I wouldn’t use no throttling for scores. Here it gave 100 on a page that scored 97 in the default mode, and no customer loads a shop over a local connection on an M3 Pro.
Before comparing two Lighthouse scores
- Which throttling method ran. It’s
configSettings.throttlingMethodin the JSON report, and a score without it can’t be compared. - Mobile or desktop. My desktop runs scored lower than the default mobile mode, so don’t assume the order.
- How many runs. The variability doc says the median of five runs is twice as stable as one run.
- Whether anything else ran at the same time. The doc warns against running reports in parallel on one machine.
- When the runs happened. My default median moved three points between two batches on the same day, so compare runs from one session.
If you run the same five commands on your own store, I’d like to hear what you get, especially if your desktop score also comes in under mobile. Leave a comment with your numbers and which mode you used.
Did this fix work on your site?
If it didn't, tell me what happened. I re-test reported fixes and update the post.

Shameem Reza Happiness Engineer at Automattic
I fix WooCommerce problems for a living and review plugins for WordPress.org. Every fix here is tested on a clean site first.


No comments yet. Ask the first question.