If you run your site through a performance test, you’ll likely reach for one of two tools: PageSpeed Insights or Lighthouse. They’re both free, both made by Google, and both produce a number out of 100. People often assume they’re the same tool with different names. They’re not.
PageSpeed Insights is the web-hosted tester at pagespeed.web.dev. It combines lab data (from a Lighthouse run) with field data (real Chrome users via CrUX). Lighthouse is the underlying engine you can run in Chrome DevTools, from the command line, or through a CI pipeline. That distinction explains most of the confusion about why the two scores don’t always match.
What is Lighthouse?
Lighthouse is an open-source audit tool from Google. It’s built into Chrome DevTools, and you can run it from the command line with npx lighthouse or as a Node module in CI. (It used to run on web.dev/measure too, but Google retired that tool and it now redirects to PageSpeed Insights.) It gives you a score out of 100 for each of four categories: performance, accessibility, best practices, and SEO. There used to be a fifth, PWA, but Lighthouse 12 dropped it.
Here’s a Lighthouse 13 run against this site from the command line, July 2026:
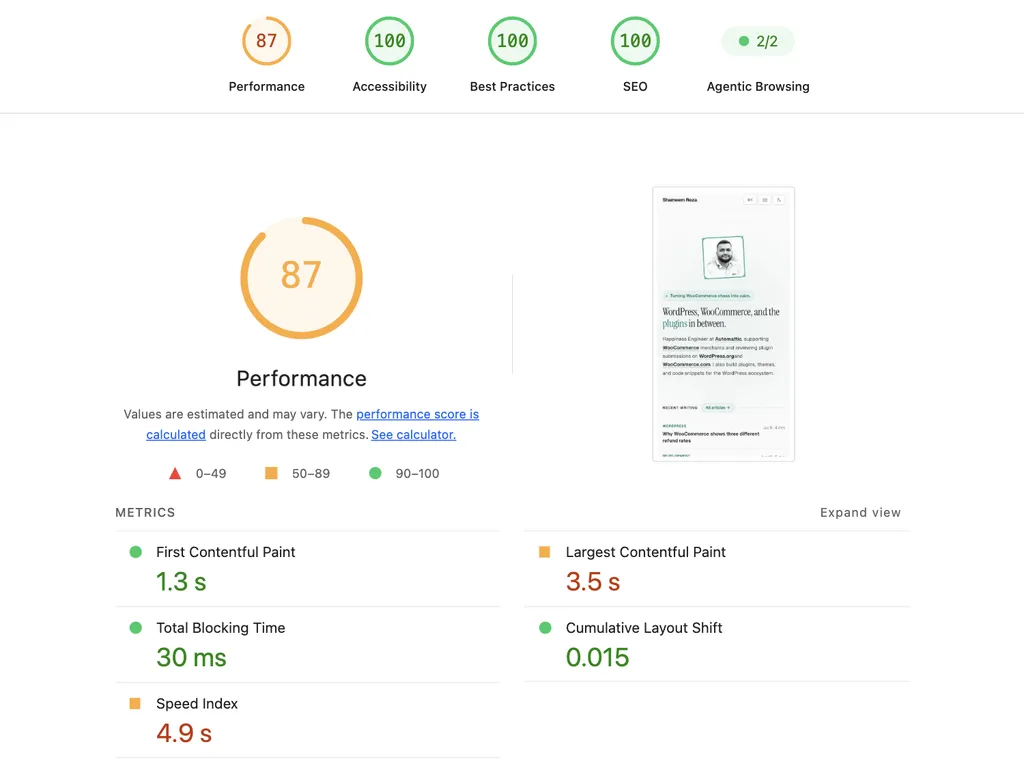
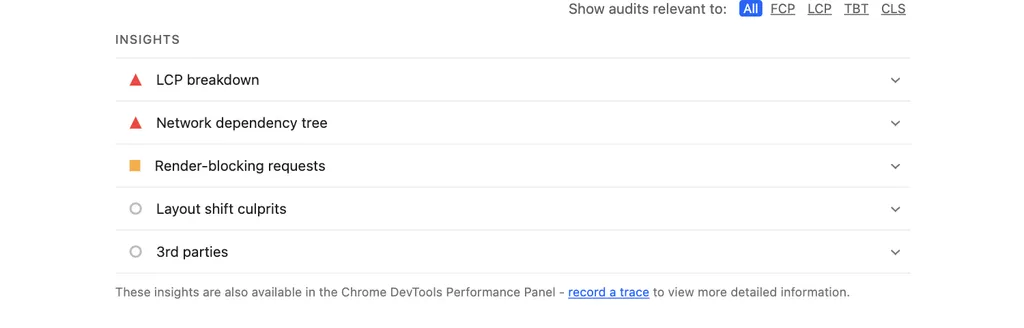
Each category comes with specific, actionable audits. Newer Lighthouse versions group the performance ones under an “Insights” section, things like LCP breakdown, render-blocking requests, and network dependency tree. I used the LCP breakdown insight to find the real bottleneck in my post on improving Largest Contentful Paint. The same insights show up in the Chrome DevTools Performance panel when you record a trace.
What is PageSpeed Insights?
PageSpeed Insights is the web-hosted version at pagespeed.web.dev. You paste in a URL, it runs Lighthouse for you in the background, and then layers in field data from the Chrome User Experience Report (CrUX) when it’s available.
This is the same site, tested on PageSpeed Insights the same morning as the Lighthouse run above:
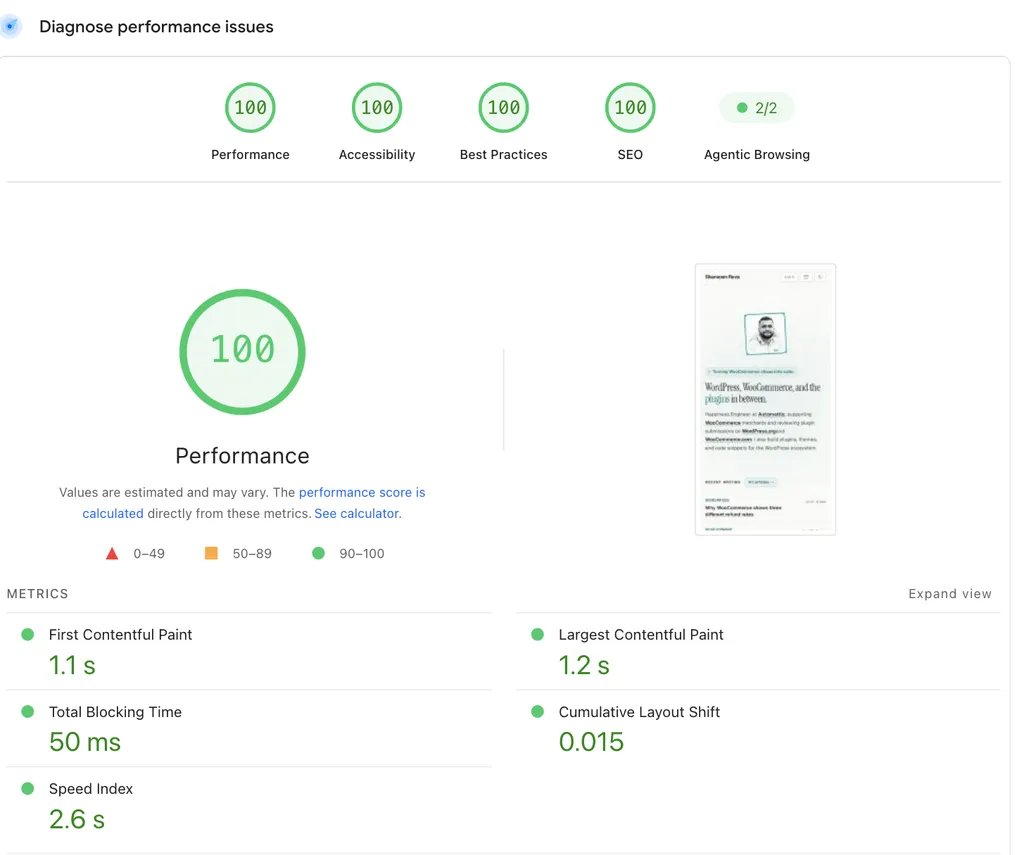
The “field data” section is the important part. That’s real-world performance for your site, based on actual Chrome users over the last 28 days. If your site doesn’t have enough traffic for CrUX data, that section will be empty and you’ll only see lab data from the Lighthouse run, which is the same thing you’d get from Lighthouse directly.
Why the scores disagree
Look at the two screenshots above again. Same page, same day: PageSpeed Insights says 100 with a 1.2 second LCP, my local Lighthouse run says 87 with a 3.5 second LCP. Neither is lying. Four things drive the gap.
Lab vs field data
Lighthouse gives you lab data: one run, one test environment, one snapshot. PageSpeed Insights blends that same lab data with field data from CrUX, which is a rolling 28-day average across real visitors on real devices and networks. If your P75 mobile user is on a cheap Android over 4G, that’s the experience CrUX captures, and it will almost always be slower than a controlled lab test.
Test location and CPU
Lighthouse in your DevTools uses your actual machine and your actual network. PageSpeed Insights runs from one of a handful of Google data-center regions on a simulated slow 4G connection and a throttled CPU. The simulated device is roughly a mid-tier Android, not the MacBook you’re running Chrome on.
Network throttling
PageSpeed Insights throttles to a simulated slow 4G. Lighthouse in DevTools uses whatever throttling profile you select (by default, also slow 4G on mobile). If your DevTools preset is “No throttling” while comparing to PageSpeed Insights, you’re not comparing the same thing.
Page variability
A single Lighthouse run can move 5 to 10 points just from variability, third-party ads, A/B tests firing, CDN warm vs cold. Comparing one local run to one hosted run is not a reliable signal. If you want a real number, run Lighthouse three or five times, take the median, and compare to the PageSpeed Insights score for the same URL on the same day.
When to use which
Use PageSpeed Insights when you want to know how real users are experiencing your site. It’s the number you should track over time and the one Google uses for the Core Web Vitals signal in Search.
Use Lighthouse in DevTools or via npx lighthouse when you’re debugging a specific page. You can re-run it as often as you want, test different device profiles, and see the detailed audit list without waiting for a hosted run. It’s also the right tool for CI, so you can fail a deploy if performance regresses past a threshold.
A shorter list of other speed tools
If you want a second opinion:
- WebPageTest: the best free tool for detailed waterfall analysis and filmstrips.
- GTmetrix: uses Lighthouse under the hood with a simpler report UI.
- Pingdom Tools: simpler score but useful for quick checks from specific regions.
- Chrome DevTools Performance tab: for deeper profiling than Lighthouse alone.
For most WordPress sites, PageSpeed Insights plus occasional runs of WebPageTest is enough to tell you whether the site is fast enough and, if not, exactly where to look.
Two sides of improving site speed
There’s a technical side: compressing images, serving from a CDN, cutting down on JavaScript, picking a solid host. And there’s an operational side: measuring the right metrics, watching them over time, and not chasing a 100/100 score at the cost of what real users actually see.
If you’re on WordPress, the biggest speed lever is usually your host. I work at Automattic, so my recommendation is WordPress.com for most sites or Pressable if you want more developer control. Both include CDN and caching out of the box, which handles most of what a stack of speed plugins tries to patch on top of slower hosts.
Join the conversation
Have thoughts, questions, or a different take? I'd love to hear from you.
Powered by Giscus · Sign in with GitHub to comment. ·Privacy policy